|
Edit report element
|   |
The Edit report element screen allows to specify the content shown to user for the report element when they run the report.
Main tab
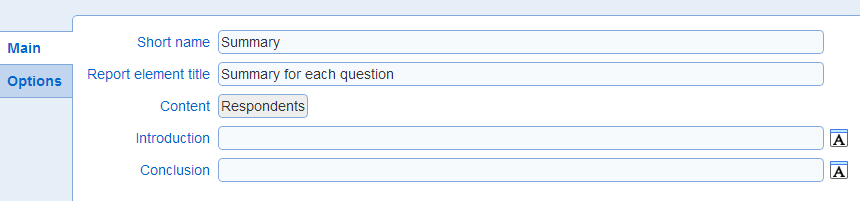
- Short name: An optional name for the report element. The short name is shown in the section. It can be used to provide a meaningful description of the purpose and content of the report element.
- Report element title: An optional title for the report element. If defined, the title is shown in the report.
- Introduction: Text shown when running the report before the content for the report element.
When the report is run on a single response (e.g., as an assessment result report), specific answers to questions and values of scores can be inserted in the text. Answers to questions are referenced using the short hand notation for questions. Scores can be inserted from the rich text editor available for the field.
- Conclusion: Text shown when running the report after the content for the report element.
The same type of special content available for the introduction is available in the conclusion also. See introduction field for details.
Options tab for report elements with 'Questions' content
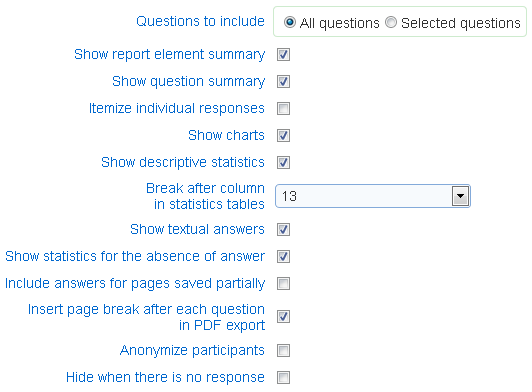
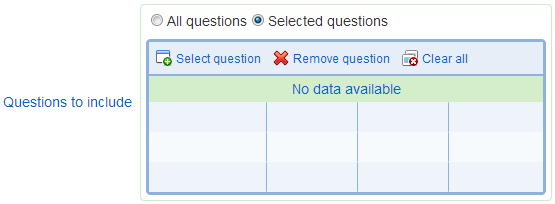
- Questions to include: Specifies which questions are shown in the report by the report element. When option 'Selected Questions' is chosen, specific questions from the surveys in the report can be added to the section element. To create a report element with no question content (e.g., to specify only text through the report element introduction and conclusion), use option 'Selected Questions' and do not add any question to the report element.
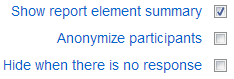
- Show report element summary: If set, summary statistic on the responses that match the filters defined for the report element will be shown in the report at the beginning of the report element.
- Show question summary: If set, the type of question will be shown in the report as well as the number of responses to the question. If the question includes a 'Not applicable' option, the number of answer to the question as 'Not applicable' is included in the report element.
- Itemize individual response: If set, the answer to each question matching the response filters defined for the report element are listed for each respondent. The answers to questions are provided in the same format as for the browse responses function.
- Response header: This option is available when option 'Itemize individual responses' is selected.

The options for the response header are:
1. Full: all demographics fields for the participant are displayed at the beginning of each response
2. None: no demographic information is shown for the responses
3. Custom: demographic fields specified as demographic substitution tags will be displayed. For example, specifying custom header:
<p>Name: [FirstName] [LastName]</br>Email: [Email]</p>
will include the header such as the one shown below before each response:
Name: John Doe
Email: jdoe@nowhere.com
- Show response history: This option is available when option 'Itemize individual responses' is selected. When this option is selected, the report element includes the audit trail data associated with the responses including who responded to each question and when, and how responses may have been deleted or changed.
- Show charts: If set, a chart will be shown for each question with discrete or numeric answers.
- Show descriptive statistics: If set, descriptive statistics will be shown for each question. The statistics shown depend on the type of question and may include counts, frequency, mean, median, standard deviations, and 25% and 75% quartiles.
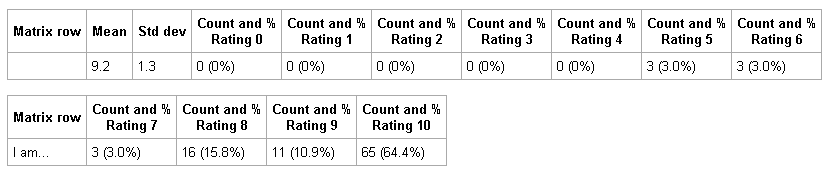
- Break after column in statistics table: Matrix questions with rank, numeric, or date data, the statistics table for the question contains information for each column in the question. Therefore, the number of columns in the statistics table can be large and exceed the width available when printing the report. For such statistics table, the table is broken into sets of columns with the sets shown above each other in the report. This option determines how many columns are shown on a line in the report before the statistics table columns are wrapped to the next line in the report.
Example: statistics table for a rank matrix segment and a value of 'Break after column in statistics table' = 10
- Show textual answers: If set, the answers provided to textual fields (e.g., from open ended textual question) will be shown for all responses that match the filters for the report element.
- Show reason not applicable: If set, reason provided to justify why a question is 'Not applicable' (see also: Allowing answering a question as 'Not applicable') will be shown. This option is available only when at least one the questions for the surveys included in the report includes the 'Not applicable' option and allows the participant to enter a textual reason.
- Show statistics for the absence of answers: If set, graphs and descriptive statistics for each question will include data corresponding to participant who did not answer the questions. These data will be identified as "no answer" in the graphs and tables of descriptive statistics.
- Include answers for pages saved partially: If set, response data for partially saved pages will be included in the report. Partially save pages correspond to pages where data was saved prior to the respondent pressing the forward button at the bottom of the page. Note that response data for partially saved pages is not fully validated and that some of the data may not conform to the constraints placed on the questions (e.g., ranges for numeric values). See also Adding or setting up an organization.
- Insert page break after each question in PDF export: If set, the PDF generated for the report will include a page break after each question.
- Anonymize participants: If set, the first name, last name, and email of the participant will be removed. If a semi-anonymous ID is available for the participant, it will be used in lieu of the participant's name.
- Hide when there is no response: If set, the report element will be shown in the report if and only if there are responses that apply to the report element. When a response filter is set for the report element, the filter may eliminate all the response available for the survey. Consequently, there can be no response available to build the content of the report element. This option allows to remove the report element from the report in such cases.
Options tab for report elements with 'Respondent' content
The options available for content 'Respondent' are a subset of the options available for content 'Questions'. See above for a description of these options.
Options tab for report elements with 'Contingency table (cross-tab)' content
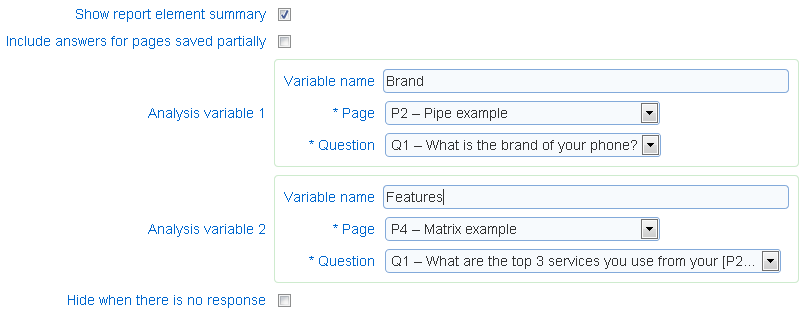
When this option is selected, 2 analysis variables must be defined. Analysis variable 1 defines the rows for the contingency table and Analysis variable 2 defines the columns for the contingency table.
- Show report element summary: See above for a description of this option for content type 'Questions'.
- Include answers for pages saved partially: See above for a description of this option for content type 'Questions'.
- Variable name: the name to use for the variable in the contingency table. The name is used as the header of the row or column in the table as appropriate (Variable 1 corresponds to the rows and Variable 2 corresponds to the columns).
- Analysis variables (1 and 2): The two question to use to compute the contingency table. The options for the first variable is show as columns in the table and the options for the second variable are shown as rows. The cell in the table show a count of responses for which the options shown in the column and row for the cell were selected.
- Hide when there is no response: See above for a description of this option for content type 'Questions'.
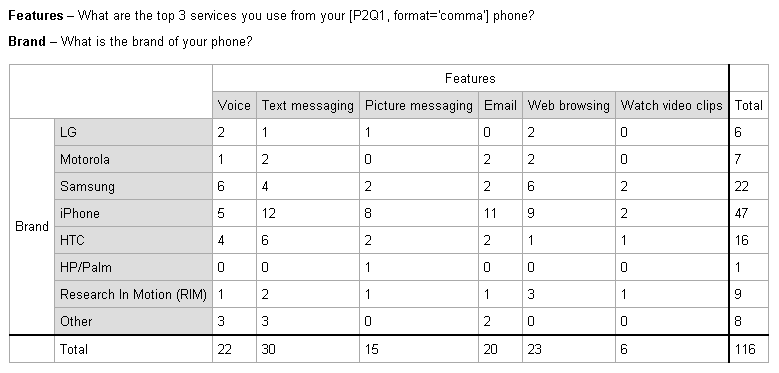
Example of contingency table:
Options tab for report elements with 'Survey completion summary' content
This type of content provides summary information for questions answered, not answered, or answered as 'Not Applicable'. To perform a drop-off analysis across a set of responses, choose option 'Show charts', and 'Show status count by question' (see below for the options available). To get detailed completion data itemized by participant, select options 'Itemize individual responses', 'Show status count by survey' and 'Show status count by question'.
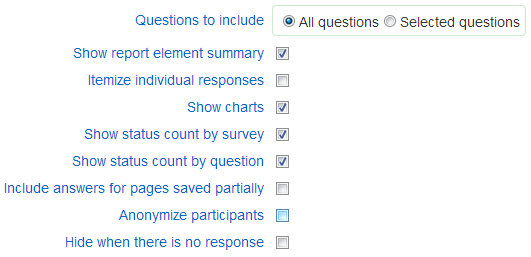
- Questions to include: See above for a description of this option for content type 'Questions'.
- Show report element summary: See above for a description of this option for content type 'Questions'.
- Itemize individual response: If set, the summary will be shown for each responses for the report element. When the option is selected, the questions answered or not answered is listed for each response for the section element. When the option is not selected, the count of questions either answered or not answered is computed across the responses for the report element.
- Show charts: See above for a description of this option for content type 'Questions'.
- Show status count by survey. If set, the number of questions answered, not answered, and answered as 'Not applicable' will be shown for each survey included in the report and for the set of responses that match the filters for the report element.
- Show status count by question. If set, the number of questions answered, not answered, and answered as 'Not applicable' will be shown for each question and each survey included in the report and for the set of responses that match the filters for the report element.
- Include answers for pages saved partially: See above for a description of this option for content type 'Questions'.
- Anonymize participants: See above for a description of this option for content type 'Questions'.
- Hide when there is no response: See above for a description of this option for content type 'Questions'.
Options tab for report elements with 'Scores' content
This type of content provides scoring information in reports.
Report elements for scores provide different information if the report is run for a single response or for a multiple responses. If the report is for multiple responses, the report element will contain distribution for the score(s) characterizing the set of responses. There will be one graph per score in the report element. If the report is for a single response, the report element will contain a single graph showing the scores for the response.
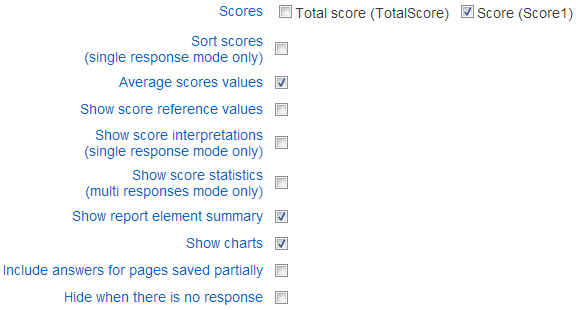
- Scores: The scores to include in the report element. If there are multiple surveys in the report, the scores are listed for each survey with scores. The name for the scores are shown as labels in the chart. To insert a line break in the label, add the following code <!--<br/>--> at the place in the label that should have the line break.
Example: Score1 has name 'Aerobic effort coefficient after 10 min of exercise'. To show the score with a line break after 'coefficient' in the chart, the name for the score should be set to: 'Aerobic effort coefficient <!--<br/>--> after 10 min of exercise'. See Score definition for the specifying the name for a score.
- Sort scores (single response mode only): If set, the scores will be sorted from high to low values before being shown in the graph and/or the table of values for the report element. This option is meaningful only when the report is run for a single response.
- Average scores values: If set the score values will be averaged for each score across all the responses in the report element. The chart for the element will display one value for each score selected for the report element. The value for the score will be the average of that score across the responses.
If the option is not set, one chart is displayed for each score. The chart will show a distribution of the score values for the responses. In most cases and unless displaying a distributions of score is wanted, this option should be selected.
- Show score reference values: If set, score reference values, if any, will be displayed alongside score value in charts. In the case of a bar chart, there will be 2 bars for each scores in the report element. One bar corresponds to the value for the score and the other bar corresponds to the reference value for the score.
- Show score interpretations (single response mode only): If set the interpretations for the scores selected for the report element will be provided. Note that this option applies to the case when the report shows data for a single response only. If the report includes data for more than one response, then this option does not affect the content of the report. This option is meaningful only when the report is run for a single response.
- Show score statistics (multi responses mode only): If set, descriptive statistics for the score values including the average, the standard deviation, the median, and the first and third quartiles are included in a table for the report element.
- Show report element summary: See above for a description of this option for content type 'Questions'.
- Show charts: See above for a description of this option for content type 'Questions'.
- Include answers for pages saved partially: See above for a description of this option for content type 'Questions'.
- Hide when there is no response: See above for a description of this option for content type 'Questions'.
Charts tab
Charts for the report element can be customized through the options available in the charts tab. By default, the charts for the report element will use the settings defined at the level of the report containing the report element. The charting options available for a report element are identical to those available at the level of the report.