|
Reports - Charting
|   |
The display options main tab defines parameters affecting the summary for the report and the graphs in the report. The options available depend on the selected Chart type. A sample chart is shown at the bottom of the page that reflects the selected options.
Options common to all charts
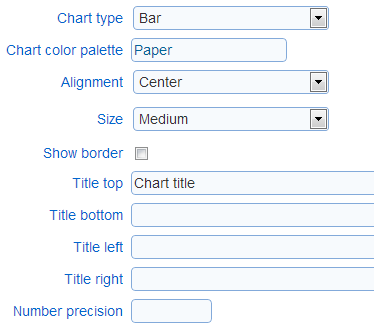
- Chart type: The type of chart to use.
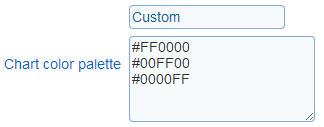
- Chart color palette: The color palette for the chart elements. Depending on the chart type the color palette will control the appearance of the bars, the segments or the points in the chart. The palette can be set to one of the predefined choices or to a custom color scheme. When the palette is set to 'Custom' the text field for the palette contains the RBG codes for each of the colors in the palette. The colors for a custom palette are defined one or two colors per line in the order in which they should be used for data series. If two colors per line are defined, the a color gradient from the first color to the second color is used for the data series.
- Alignment: Controls the positioning of the chart in the page of the report
- Size: Controls the size of the chart. Three predefined sizes are available. A custom size can be defined through option 'Custom'.
- Show border: Controls if a border is shown around the chart
- Number precision: The number of digits after the decimal point to show for labels in the chart. For example, if the label for a bar is value 10.235 and number precision is set to 1, then the label for the bar will be 10.2.
Background for 2D charts:
For two dimensional charts, the chat background of the chart can be set to a solid color or to an image. If both options are set for the same chart, only the image option will be reflected in the chart.
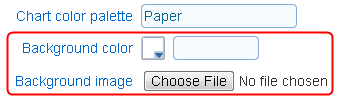
- Background color: The color to set as the background for the chart. The background for the legend will also be set to the color specified.
- Background image: The image to use as the background for the chart. If the image size does not match the size of the chart, then the image will be stretched to match the chart horizontal and vertical dimensions.
Options for bar charts
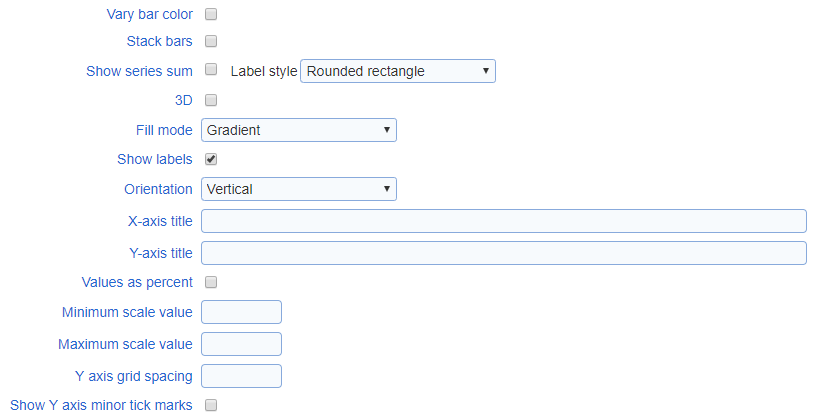
- Vary bar color: varies the color of the bars in the chart based on the x-axis label for the bar rather than the data series associated with the bar. For charts with a single data series, each bar in the chart will have a color based on the colors in the palette.
- Stack bars: show the data series in the bar chart stacked above each other instead of side by side.
- Show series sum: When the chart is a stacked bar chart, the sum of the value for each bar for a given category (i.e., position on the X axis) can be shown above the bars.
- Label style: The style to apply to the series sum when it is shown.
- 3D: Controls if the chart is shown in 2D or 3D
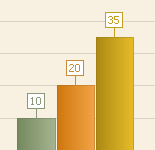
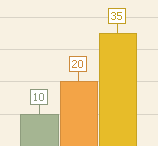
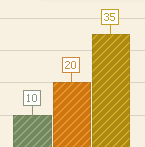
- Fill mode: Specifies how the bars in the chart are filled in. This option is available for 2D bar charts only.
|
|
|
|
|
Gradient |
Solid |
Hatched |
- Show labels: Controls if the bars are labeled with their values
- Orientation: Controls the orientation (vertical or horizontal) of the bar chart
- Titles (X-axis, Y-axis): Controls the titles for the chart axes. The size of the text for the axes can be set using the 'size' tag in manner similar to the chart titles.
- Y-axis as percentage: Controls if the Y axis should be treated as a percentage. If the option is set, the values on the chart Y axis will include a percent sign (%) and the values for the bar will be computed as percentages of the total number of data points in the data series.
- Scale values (minimum, maximum): Sets the minimum and maximum values for the Y axis. If no value is provide the range for the Y axis is determined from the data included in the chart.
- Y axis grid spacing: Set the spacing between lines of the Y axis grid and between major tick marks for the axis.
- Show Y axis minor tick marks: Controls if minor tick marks are displayed for the Y axis.
Options for pie charts:
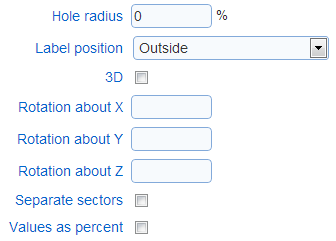
- Hole radius: Controls if the pie chart is show with segment completely filled in or with a hole in the center (i.e., as a doughnut chart).
- Label position: Controls the position of the labels for each of the segments in the chart
- 3D: Controls if the chart is shown in 2D or 3D
- Rotation (X, Y, Z): Controls the perspective of the chart when the chart is shown in 3D
- Separate sectors: Determines if the segments in the charts are joined to each other or separated by some white space
- Value as percent: Controls if the values for the chart should be treated as a percentage. If the option is set, the labels for the segments include a percent sign (%).
Options for line charts
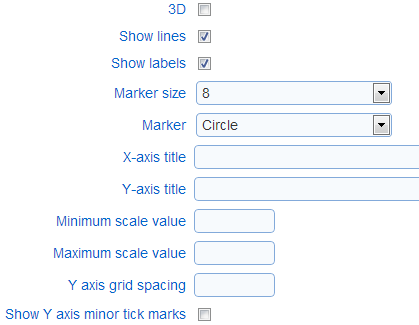
- 3D: Controls if the chart is shown in 2D or 3D
- Show lines: Controls if the points in the chart should be connected with a line
- Marker size: Determines the size of the markers used for the points in the chart
- Marker: Control the shape of the markers used for the points in the chart
- Titles (X-axis, Y-axis): The text titles for the axes in the chart
- Scale values (minimum, maximum): Sets the minimum and maximum values for the Y axis. If no value is provide the range for the Y axis is determined from the data included in the chart.
- Y axis grid spacing: Set the spacing between lines of the Y axis grid and between major tick marks for the axis.
- Show Y axis minor tick marks: Controls if minor tick marks are displayed for the Y axis.
Options for radial charts
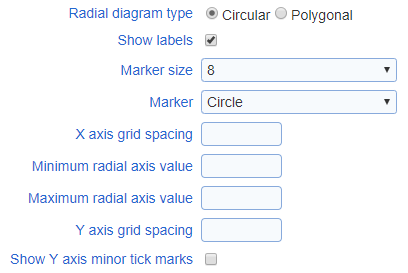
- Radial diagram type: Control if the diagram is shown as a circle or as a polygon. If the diagram is shown as polygon, the number of sides of the polygon is determined by the number of points in the series for the chart (e.g., if the series have three points each, the diagram is drawn as a triangle).
- Show labels: Controls if the point in the charts are labeled with their values
- Marker size: Determines the size of the markers used for the points in the chart
- Marker: Control the shape of the markers used for the points in the chart
- X axis grid spacing: Determines the values shown for the grid corresponding to the axis encircling the graph when the graph shows numerical values
- Radial axis values (minimum, maximum): Sets the minimum and maximum values for the radial axis in the chart. In no values are specified the range for the axis is determined from the data in the chart.
- Y axis grid spacing: Set the spacing between lines of the Y axis grid and between major tick marks for the axis.
- Show Y axis minor tick marks: Controls if minor tick marks are displayed for the Y axis.
Constant lines
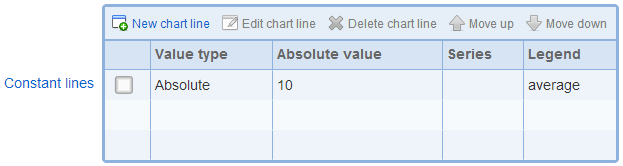
In two dimensional bar and line charts, lines with constant values for the Y-axis can be added to the chart. These lines can be used to display meaningful thresholds of values or the average values for the series in the chart. Constant lines are shown in the chart legend in the order in which they are listed in the constant line table.
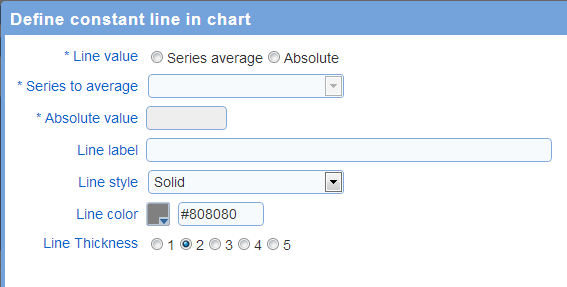
- Line value: The value for the constant line. The line can be set a fixed value or as the average of a series of point in the chart.
- Series to average: If the line value is 'series average', this option controls which of the data series in the chart will be averaged. For example, if the chart display a set of scores for a response and each score has a reference values, there will be 2 series in the chart. One series will represent the scores for the response and the other series will represent the reference values.
- Absolute value: If the line value is 'absolute', this options set the value for the line.
- Line label: The text label to shown in the chart legend for the line. To include the value for the line in the label, use special tag '[DataValue]'. For example, setting the label to
Average = [DataValue]
and the value for the line is 10.2, then the label shown in the legend for the line will be 'Average = 10.2'.
- Line style: The style for the line
- Line color: The color for the line
- Line thickness: The thickness for the line
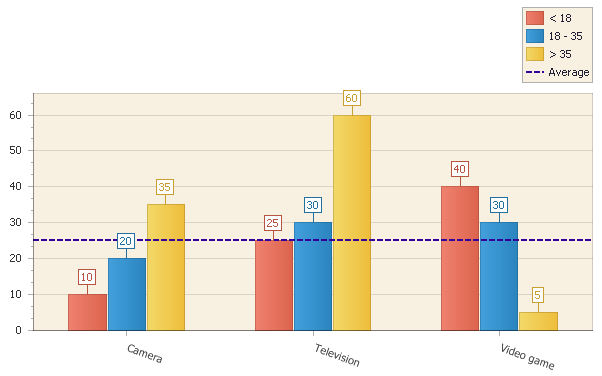
Example: Horizontal set as the average of the first series in the chart -- 25 = average (10, 25, 40)
Strips
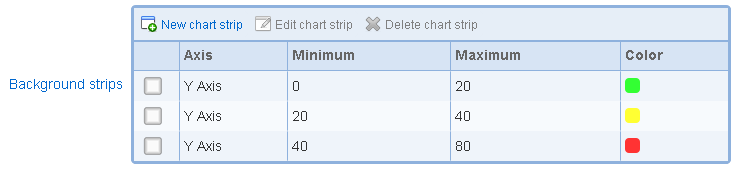
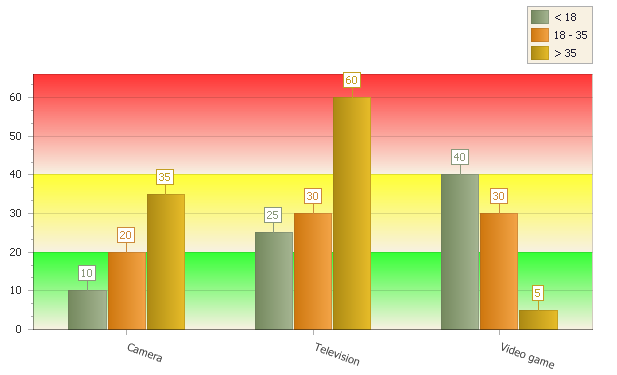
In two dimensional bar and line charts, strips of color can be added to the chart. For bar charts, strips can be added to the Y axis. For line charts, strips can be added to either the X axis or the Y axis. Strips can be used to display meaningful ranges of values in the chart (e.g., low, medium, and high ranges of values). Strips are displayed in the diagram for the chart only and are not referenced in the legend for the chart.
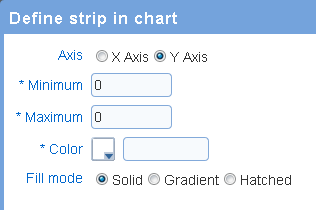
- Axis: the axis for the strip. For bar charts, only the Y axis should be selected. For line charts, either the X axis or the Y axis can be selected.
- Minimum: the value that correspond to the lower bound for the strip.
- Maximum: the value that correspond to the upper bound for the strip.
- Color: the color to use for the strip.
- Fill mode: determines how the strip is filled with the selected color:
- Solid: the strip is filled with a solid color
- Gradient: the strip is filled with a gradient based on the selected color
- Hatched: the strip if filled with a hatch pattern bade on the selected color.
Example: chart with three strips for ranges 0 to 20, 20 to 40, and 40 to 80